-
August 29th, 2017
-
Charlie Bilello
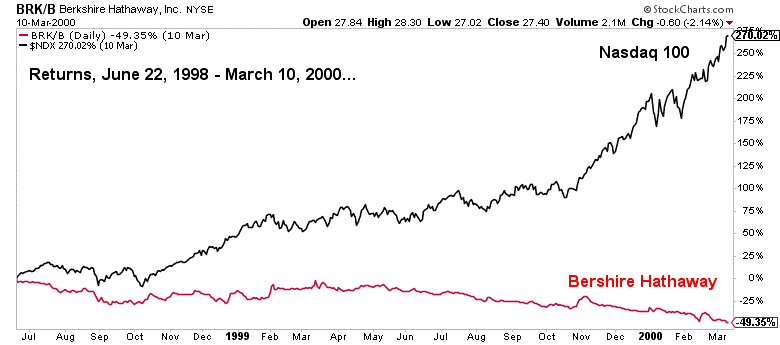
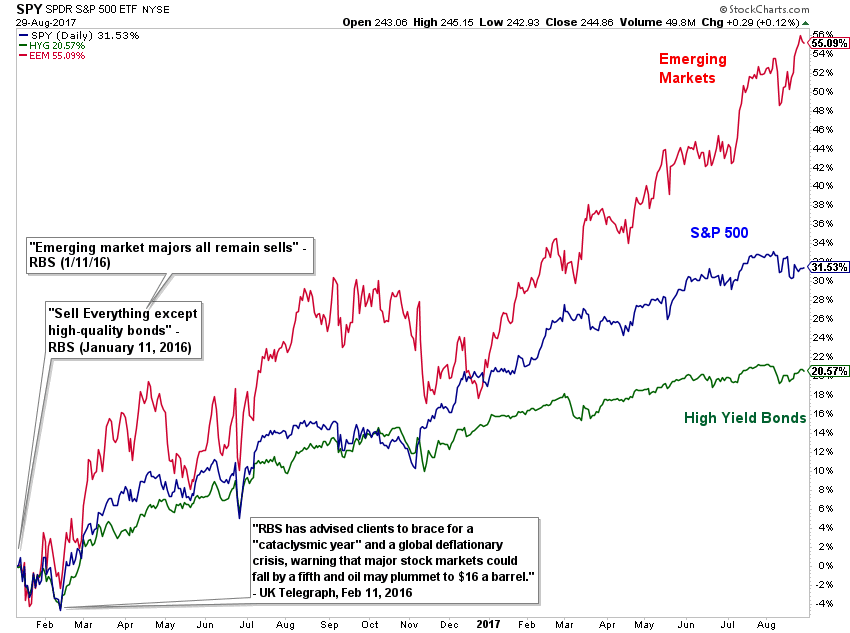
Put these charts on your wall for reference the next time you think…
-
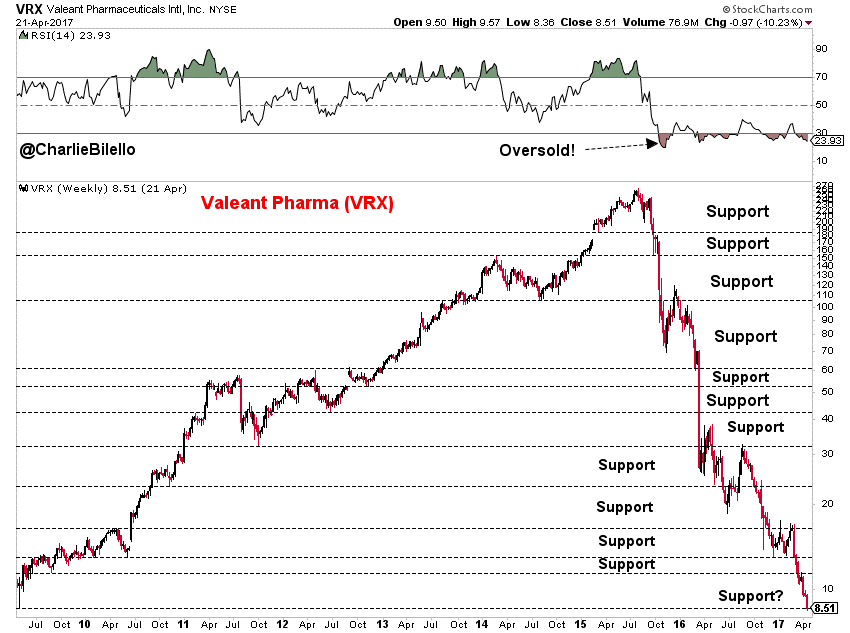
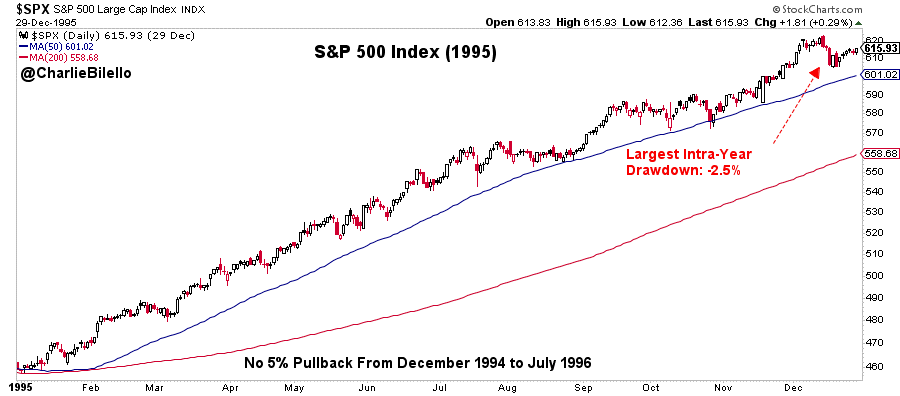
Something is «oversold» or «at support» and has to go back up…
-
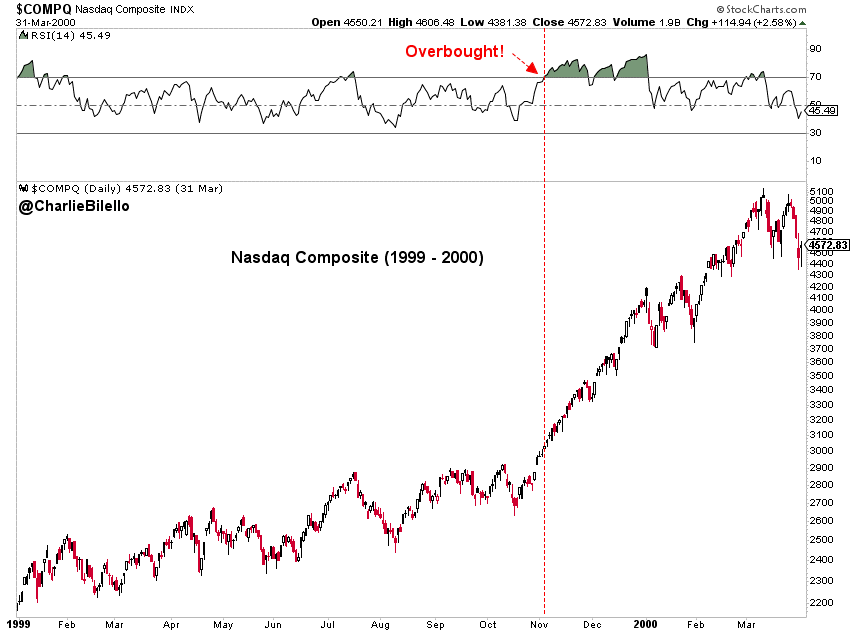
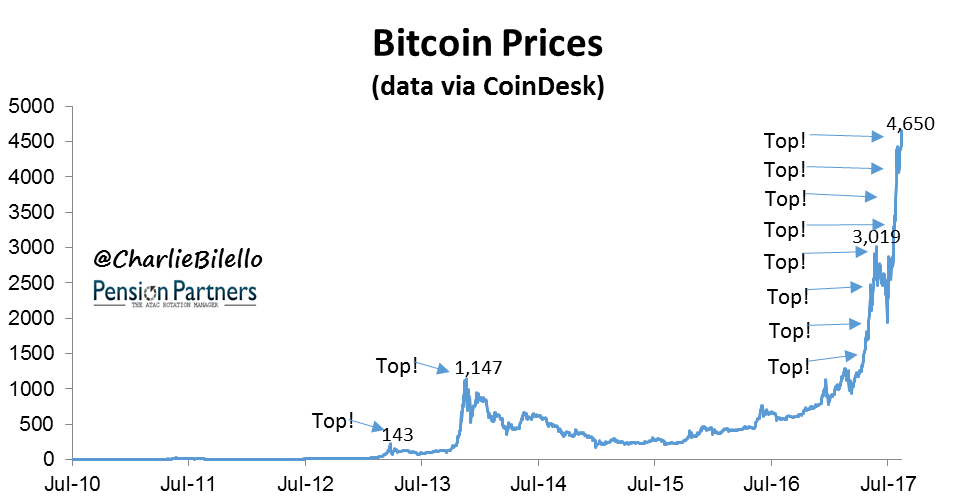
Something is «overbought» and can’t go higher…
-
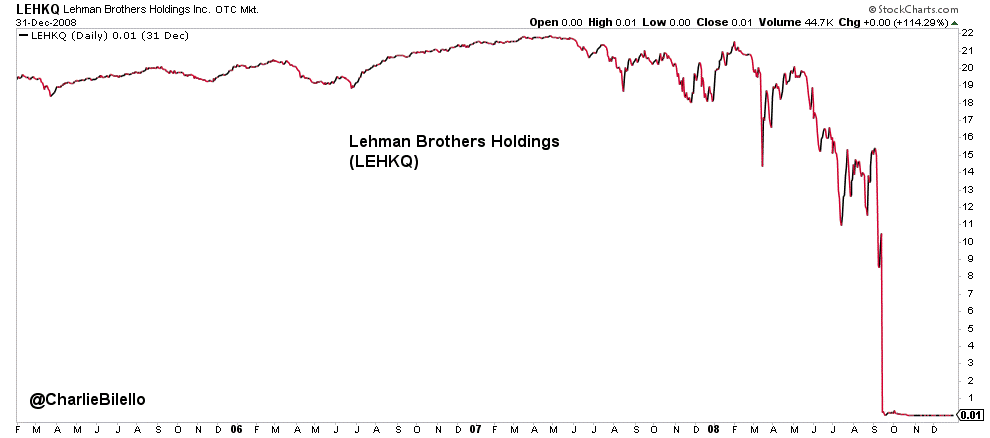
It can’t go to 0…
-
It is certain to default…
-
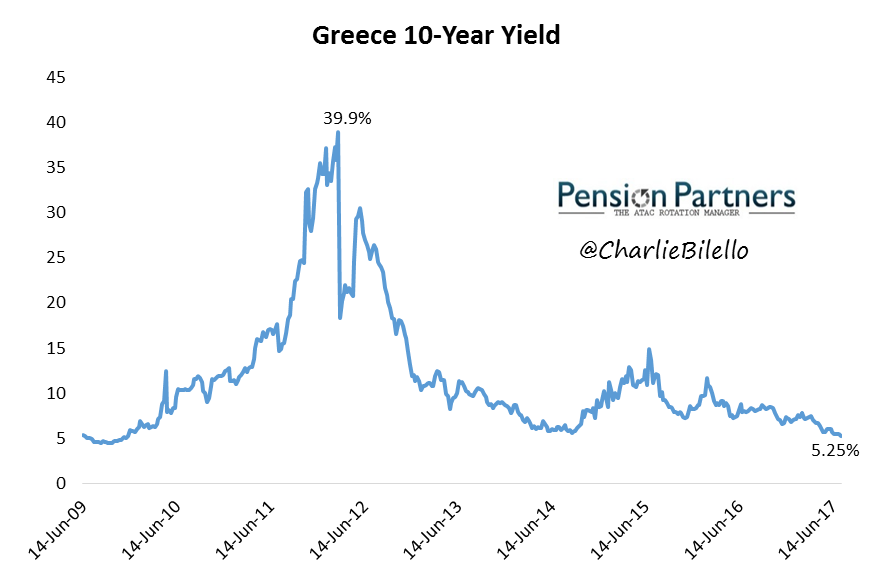
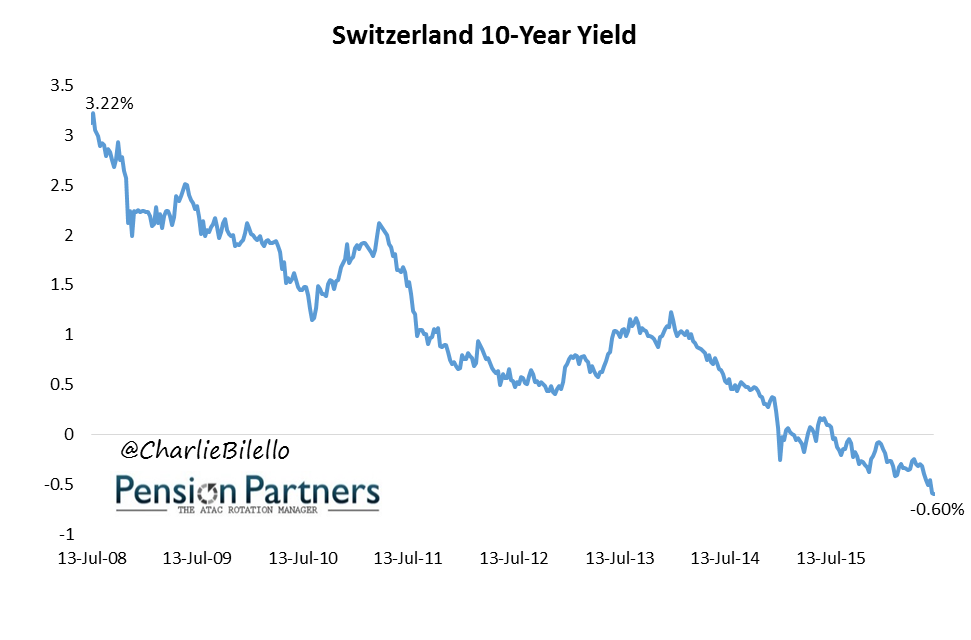
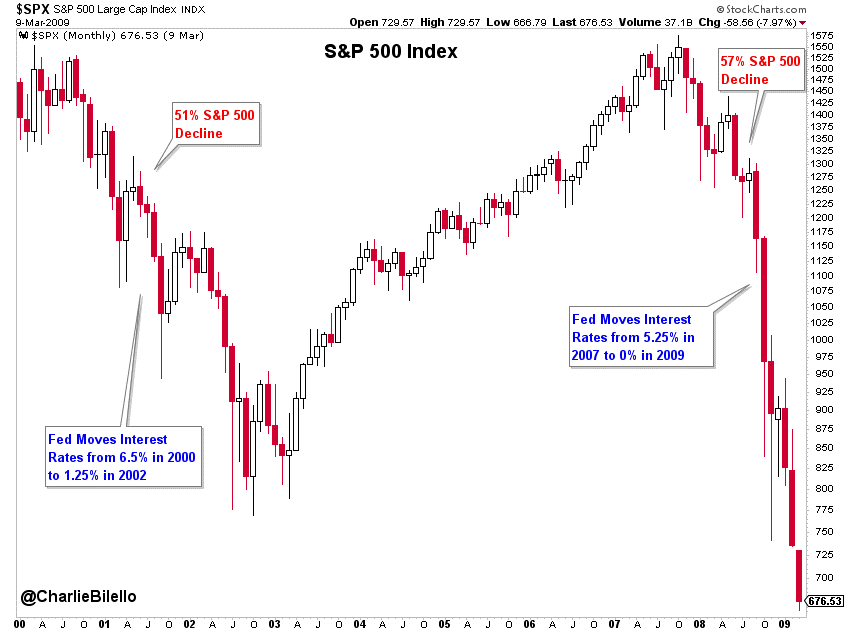
Interest rates can’t possibly go any lower…
-
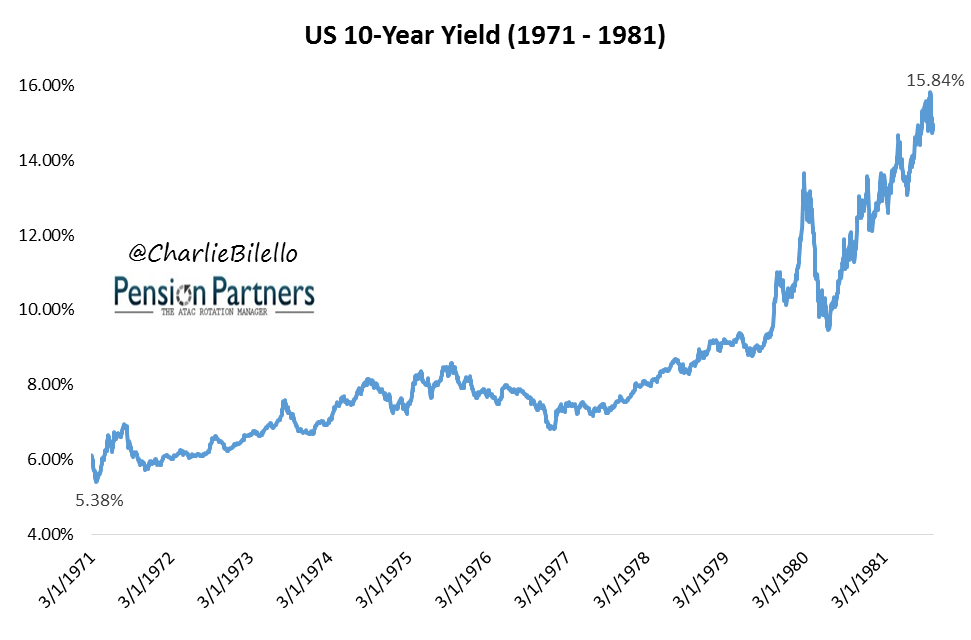
Interest rates can’t possibly go any higher…
-
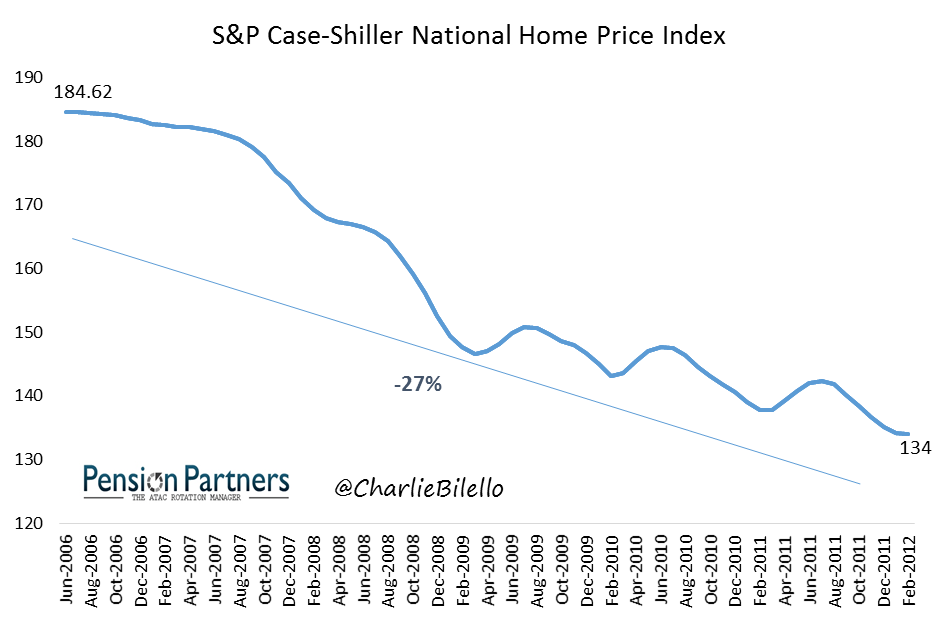
Housing prices only go up…
-
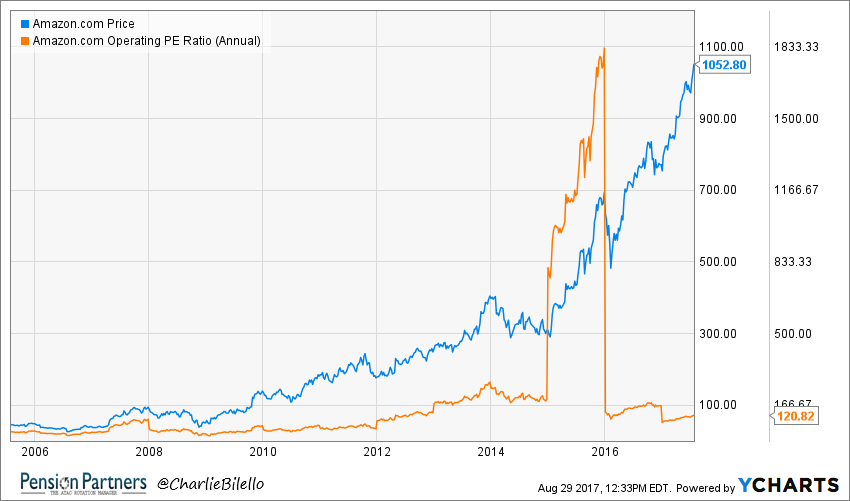
Valuation is a good reason to short something…
-
You can call a bubble/top without the benefit of hindsight…
-
Waiting for a correction will surely enable you to buy in at a lower price…
-
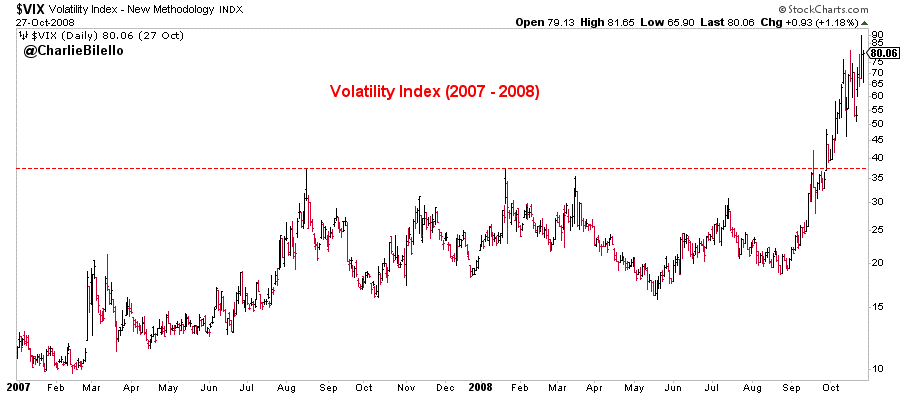
Volatility can’t possibly go any higher…
-
The Fed can prevent the stock market from going down…
-
Value investing is easy…
-
Following pundits/gurus is an effective investment strategy…
They say a picture is worth a thousand words but in investing it is worth so much more. Having a few extreme charts on your wall can be a helpful reminder that there is no such thing as «can’t,» «won’t,» or «has to» in markets. The market doesn’t have to do anything, and certainly not what you think it should do. The market doesn’t abide by any hard and fast rules; it does what it wants to do – when it wants to do it.
That’s what makes it so hard and at the same time so interesting. And that’s why listening to the endless prophesies of gurus and pundits can be so dangerous. They don’t know anything more about the future than you or I, which is to say they don’t know anything at all.
Find some charts that speak to you personally, and post them on your wall. Hopefully they’ll serve as a constant reminder that the range of possible outcomes is much wider than you think. You will need to suspend your disbelief at times to succeed, because the market is forever doing things that it has never done before. There is no impossible in this wonderful game, only more or less probable. Truly understanding that can go a long way toward controlling your emotions and becoming a better investor.
***

