Gregg S. Fisher, CFA, «Invest with Reason»
July 12th, 2016 | by
- «Brexit» has many investors concerned about the potential for a severe market correction.
- Gerstein Fisher examined nearly a century and a half of equity market data to examine patterns around past market corrections and recoveries.
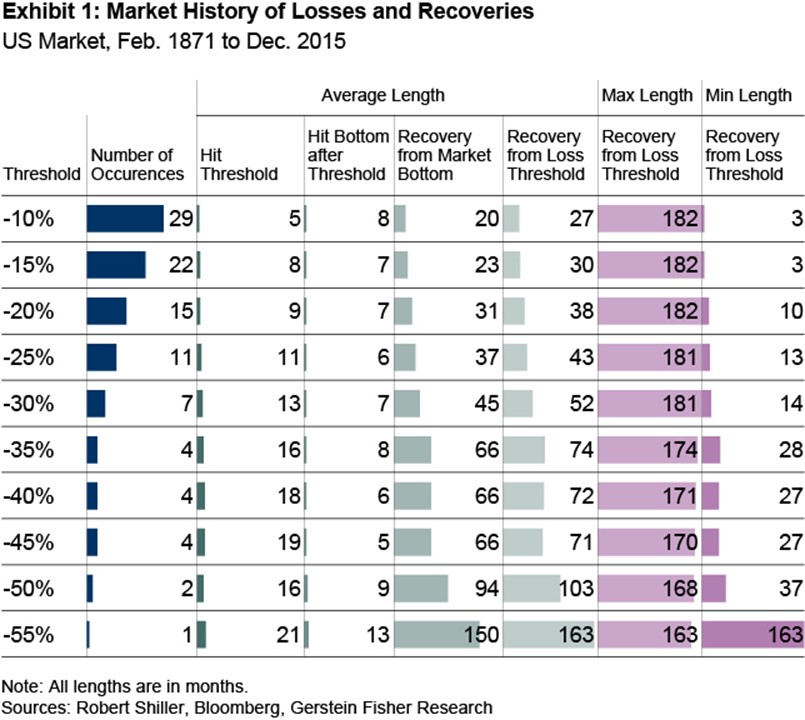
- The study found that corrections of 20% or more happened about once a decade over the period; 30%+ declines occurred approximately once every 20 years.
- Results in this study can help condition investor expectations around the risks associated with investing in equities.
We’re not predicting a market correction of 20%. In fact, we’re not making any predictions at all. But since the clouds of uncertainty billowing from Great Britain and Brexit are shaking financial markets worldwide, I thought it would be an opportune time to conduct some historical research on the patterns and frequency of stock market losses and subsequent recovery periods.
When we crunched the numbers for 145 years of US stock market history[1], we found that from 1871 to 2015, the US market (including reinvested dividends) generated an annualized compound return of 8.87%–thus, $1 invested on February 1, 1871 would have multiplied to $222,000 at the end of 2015. Yet the 145-year ride was far from smooth, punctuated by 15 independent market declines of 20% or more and seven slumps that exceeded 30%.
Our study addressed the following questions:
- How often does the market decline by a particular threshold?
- How long does it take for the market to decline by that amount?
- After the market declines by a certain amount, for how many more months will the market continue to decline?
- How long from i) the trough of the market and ii) the loss threshold will it take for the market to recover?
Loss and Recovery
Exhibit 1 summarizes our findings but calls for some explanation. Here’s how to read the table: starting from the left, we analyze different scenarios from 1871-2015 for loss thresholds of 10% to 55% in 5% increments, with decline defined as the total return (or loss, really) peak to trough that exceeds a loss threshold. So for instance, if we observed that the market fell 17% before rebounding, this would not count as a decline if the loss threshold is 20%. The second column reports how many times losses that pierced each threshold occurred. For example, 20% declines (a common definition of a «bear market») happened 15 times, or about once per decade on average, whereas 30% declines occurred seven times, or roughly once per 20 years.[2]

The third column details the average number of months it took to reach each loss threshold; for market losses of 25% or greater, for example, 11 months elapsed to reach the -25% mark. Having reached each loss threshold, the fourth column states how many more months the market declined, on average, before reaching the trough (e.g., during the 11 occasions when the market fell 25%, on average it continued to fall for another six months before reaching the bottom).
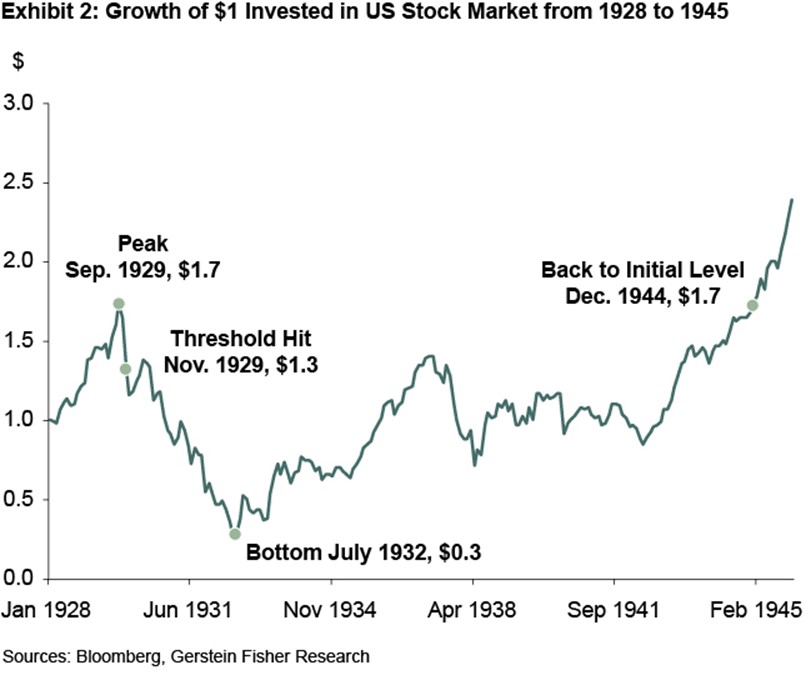
Now let’s move on to the pattern of market recovery for each loss threshold. After a decline meets the criterion for a loss threshold, we examine how long it then takes for the investor to break even again (i.e., recoup market losses) using two different time periods: from the trough and from the loss threshold. Since this is a bit complicated to conceptualize, I have graphed one real-life—but extreme–example in Exhibit 2 to help readers visualize what I’m talking about.
Here we chart the bust during the Great Depression and the long, long road to market recovery (astute readers will correctly guess that the off-the-chart maximum period of 182 months in Exhibit 1’s penultimate column is this pitch black period in US market history). In this graph, the September 1929 peak is the starting period and the -10% threshold was breached in November 1929 (in our study we use month-end points throughout, which explains why the market was down much in excess of 10% by the end of November 1929). The market bottomed in July 1932 and took 150 months from bottom to return to breakeven and 182 months, from November 1929 to December 1944, to recover from the loss threshold. Related to outliers such as this, statistics junkies will be interested in the relatively low standard deviation of months to hit a loss threshold, but the large variance in market recovery periods. For example, the standard deviation to reach the 20% loss threshold is only 5% (and 8% to the bottom of the market), but 43% when it comes to the recovery period from that loss threshold.
 Past, Present, and Future
As investors today, how can we make use of historical data such as this? After all, none of us is too likely to live for 145 years and, anyway, past performance is no indicator of future performance.
For one thing, we can use the results in this study to condition our expectations and understand the risks associated with investing in equities. Since an investment lifetime for most investors will be at least 50 years (say, from age 25 to 75), or about 1/3 of our historical study period, you may gain some idea of what to expect during your investing career. Market declines are a natural, inevitable part of investing in equities. But since those declines are often unpredictable and difficult (or impossible) to forecast, we think that the best way to reap equity market premiums (i.e., the return on equities minus T-bills) is to adopt a strategic approach and continue to invest in equities during market declines.
[1] From January 1871 to December 1925 we used market data from Prof. Robert Shiller on the S&P composite; from February 1926 to December 2015, we used the S&P 500 Index (Source: Bloomberg).
[2] Our research for this study is based on monthly data, not daily returns data, for which the results would be quite different. For instance, when we crunched the daily numbers for 1928 to June 2015, we discovered that 30% declines occurred on average every 4.9 years.