Matthew Allbee
Mar. 8, 2016
Summary
The Leading Index of the United States, compiled by the Philadelphia Federal Reserve, has had remarkable accuracy in predicting recessions and expansions in the United States.
It has done all of this with no false-positives since the index was created in 1982.
Even more impressive, though, is the reliability with which it has called market tops and bottoms over the years.
It would seem hard to believe if I told you that there was an indicator that had successfully called all 3 of the recessions since the beginning of the 1990s. Even more, this indicator had no false-positives throughout this testing period. Incredibly, it also managed to signal near the exact stock market peak before these downturns.
As I’m sure you’ve figured out, this indicator isn’t just a hypothetical. In fact, it’s actually very popular and widely followed throughout Wall Street and the larger investment community. This indicator is the Leading Index of the United States.
This metric, which is compiled by the Federal Reserve Bank of Philadelphia, is a compilation of individual state indices which track such things as initial unemployment insurance claims for each state, state-level housing permits, the ISM manufacturing survey, and the spread between 10-year and 3-month Treasuries. Unfortunately, the Federal Reserve site only has info back to 1982 (when it began to be recorded if my memory is correct). So, we can’t take this analysis back any further.
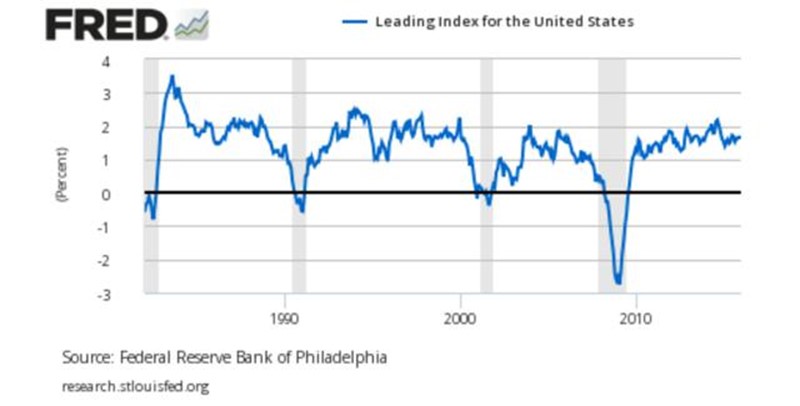
Above is a chart for the month-over-month change percentage change in the leading index. Here’s the kicker: every single time this percentage has fallen below 0.9% the economy has fallen into a recession.
I mean literally every single time. Resetting the clock at 1.1% (an arbitrary amount to signify that moving above and below 1% in short order shouldn’t be taken as a signal), this index has never had a false-positive.
What’s even more incredible is the accuracy with which this index has been able to call stock market peaks and troughs. If you had shorted the market whenever the leading index showed a percentage change of less than 0.9% and held it until it was back at 1% over these last three recessions, you would’ve made good returns. From the 1990 recession, the S&P 500 fell about 1% from April 1990 through July 1991, 24% from September 2000 through April 2001, and an astounding 31% from June 2007 through November 2009.
You might believe these astounding returns are only the result of the extraordinary market conditions in both 2000 and 2007. I would have to agree, but that doesn’t discredit the fact that going short when this indicator signals and otherwise staying long an index fund would have done significantly better than buy and hold over this time period.
If you need more convincing on the efficacy of the leading index, I recommend you look at what points it signals you should go short the market, using the S&P 500 as a proxy, and then what at what points it signals that you should exit your short. Each signal to buy or short the market matches up nearly with the top and bottom of each bull and bear market since 1982.
Right now, the leading index most recent reading was at 1.65%. With inflation supposedly rising and employment continuing to rebound, It seems the leading index should continue to grow at a strong paste into the foreseeable future. With this, the stock market should continue to grow throughout the rest of the year.
As a word of caution, the leading index is, perhaps unsurprisingly, not a good indicator of market movement unrelated to economic growth. For instance, it didn’t predict the drop in prices at the start of this year. Nonetheless, it has a very strong record overall, and should definitely be a part of your investor toolbox.
